PROXIMANOVA-LIGHT.OTF PROXIMANOVA-LIGHTIT.OTF PROXIMANOVA-EXTRABLD.OTF PROXIMANOVA-BOLD.OTFPROXIMANOVA-BLACK.OTF
Get this font in here!
This Article Applies to:
- Avast Business Hub
The Web Control report provides details on all web traffic recorded on your devices within a defined time frame.
This report is available at site level only.
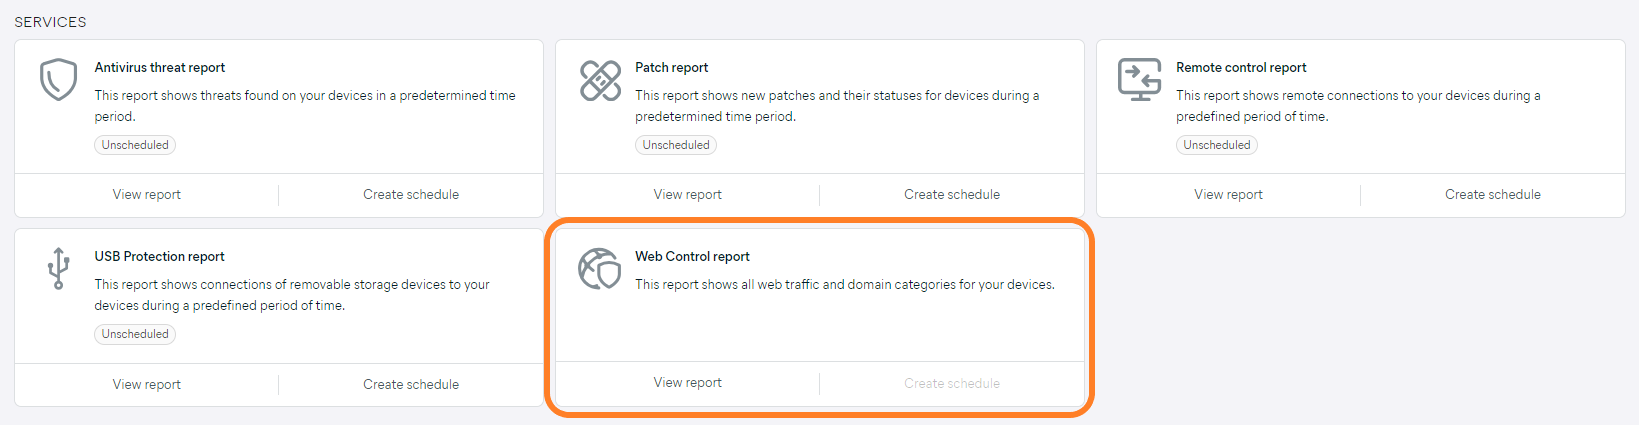
The report can be accessed from the Services section of the Reports page.
Report Details
At the top of the page, you will see a doughnut chart showing the amount of web requests (percentage and number) detected during a specified time frame, categorized as follows:
- Allowed
- Blocked by admin
- Blocked as dangerous
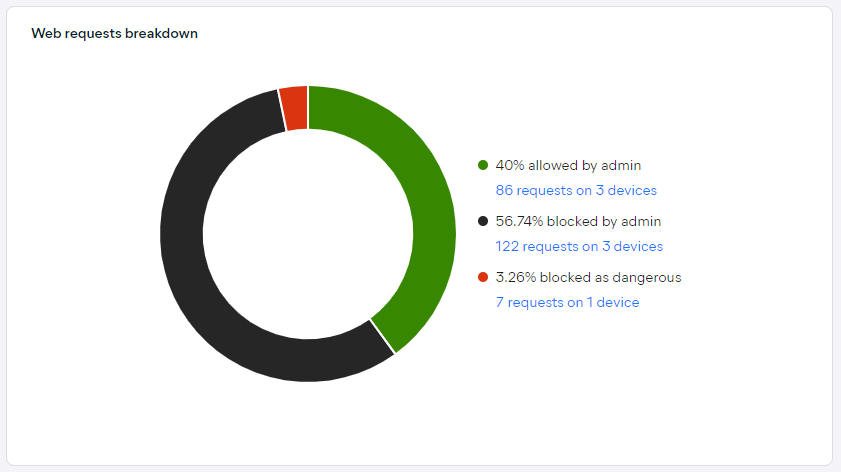
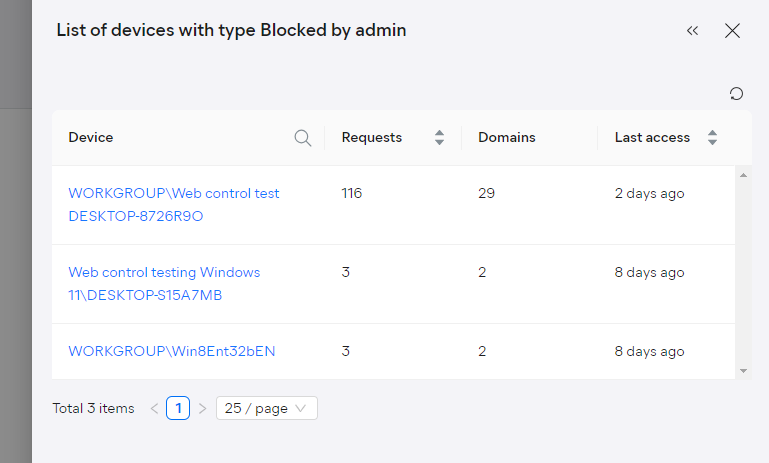
Clicking the available links will open a drawer displaying more detailed information for each category:
- Devices that requested access
- Number of requests each device made
- Number of domains each device requested to access
- Last time each device requested access
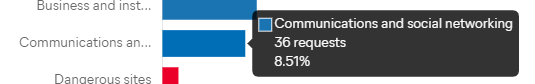
The bar chart to the right will show the most visited categories.
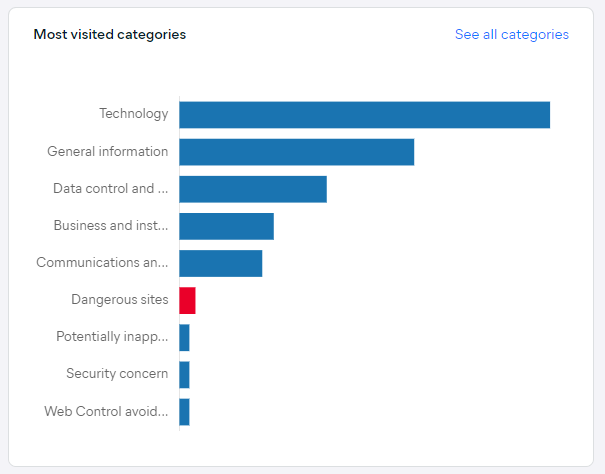
Hovering over a bar will display the exact volume (number and percentage) of requests for that particular category.
Clicking See all categories in the top right corner will display the categories, subcategories, top visited domains, number of devices that those categories accessed, and the number of visits to those domains.
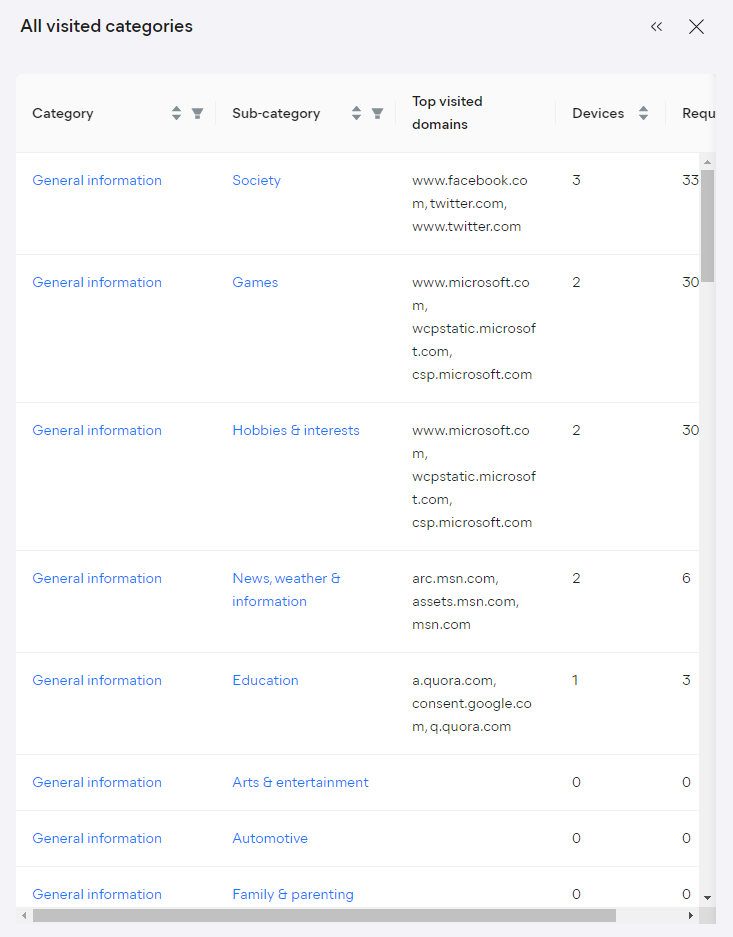
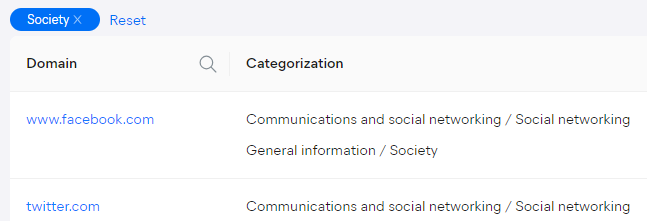
Clicking a (sub)category will automatically filter the table in the report to show the results only for that (sub)category.
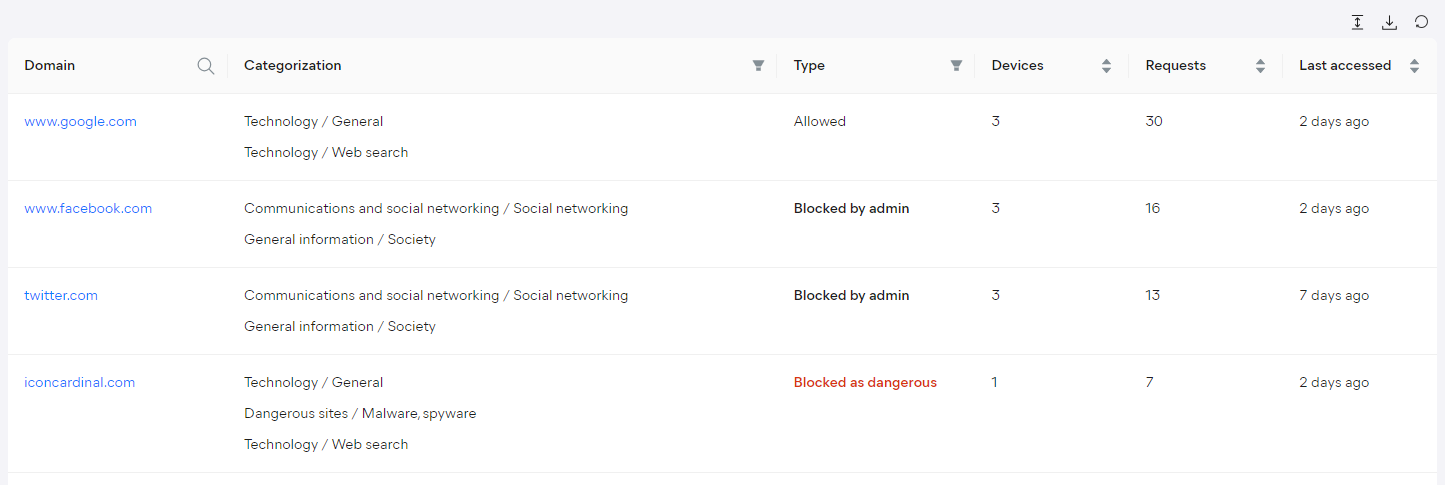
This table at the bottom of the report will display more detailed information about web requests detected on the devices during the defined time frame. For each listed domain, you can see the following information:
- Domain category/categories
- Permission type (Allowed, Blocked by admin, Blocked as dangerous)
- Number of devices that requested access
- Number of requests
- Date/time of last request
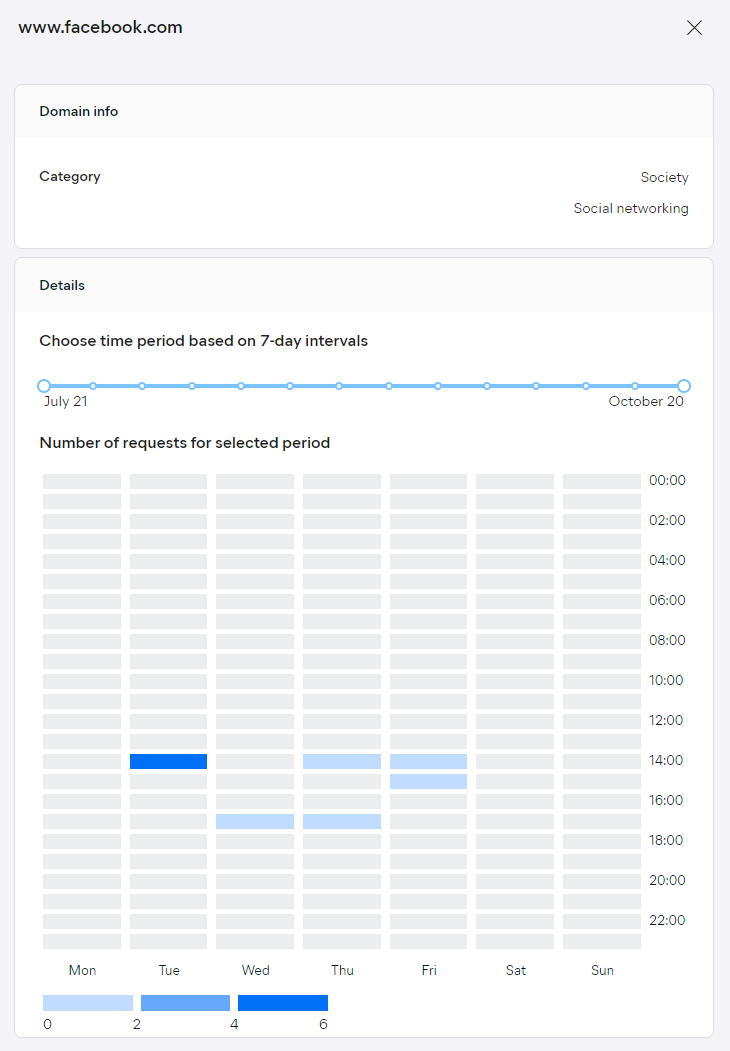
Clicking a listed domain will open a drawer showing more information for that domain.
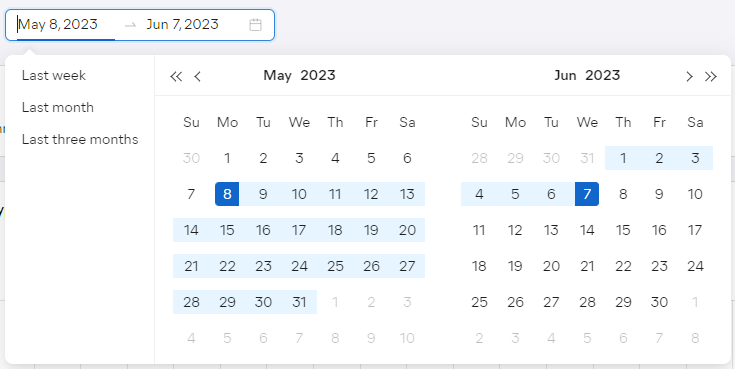
By default, the report will display information for the last 30 days. You can adjust the time frame by clicking the start or the end date and then choosing different dates from the calendar, or by selecting one of the quick options on the left (Last week, Last month, Last three months).
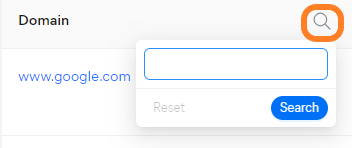
To facilitate data lookup further, you can search by domain.
You can also filter the report by domain categorization and permission type, and the remaining columns can be sorted to display the results in ascending or descending order.
Machine Visits
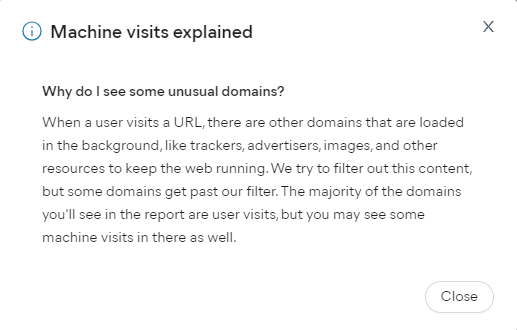
The warning in the report confirms When a user visits a domain, there are domains that are loaded in the background. We filter as many of these machine visits from the report as possible.

Selecting Learn more will open the Machine visits explained dialog.
Scheduling and Exporting
Scheduling is currently not available for the Web Control report, but we are planning to add this functionality in the near future so your reports can be automatically generated and emailed to specified users.
If needed, you can manually download the report in