PROXIMANOVA-LIGHT.OTF PROXIMANOVA-LIGHTIT.OTF PROXIMANOVA-EXTRABLD.OTF PROXIMANOVA-BOLD.OTFPROXIMANOVA-BLACK.OTF
Get this font in here!
This Article Applies to:
- Avast Business CloudCare
From the Operational section of the CloudCare console's Reports page, the following reports can be accessed:
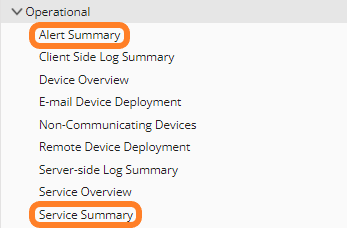
- Alert Summary
- Client-Side Log Summary
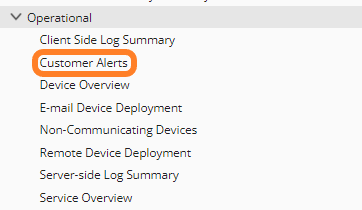
- Customer Alerts
- Device Overview
- E-Mail Device Deployment
- Non-Communicating Devices
- Remote Device Deployment
- Server-Side Log Summary
- Service Overview
- Service Summary
Note that the Customer Alerts report is only available at partner level.
On the other hand, Alert Summary and Service Summary are available at customer level only.
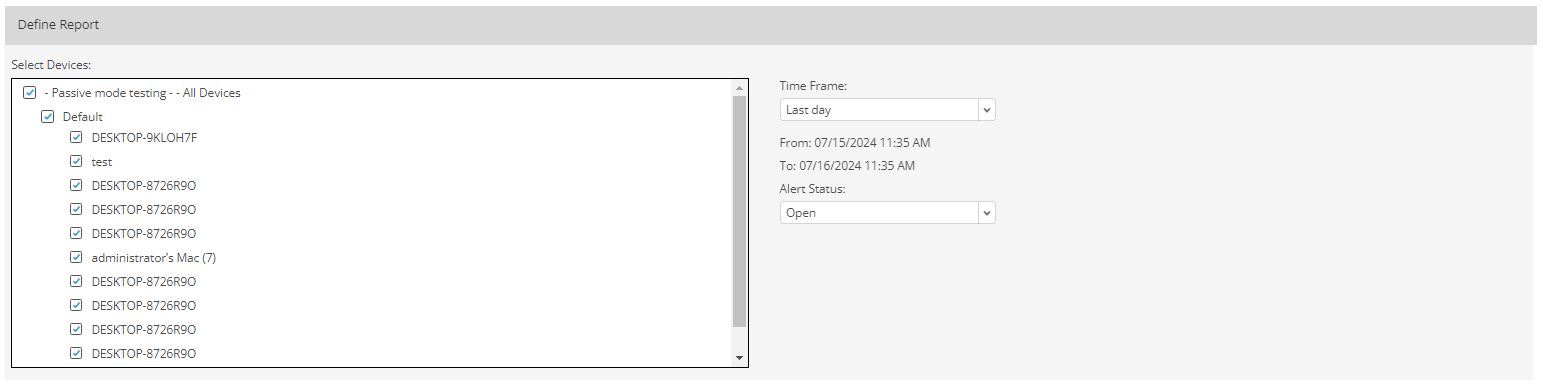
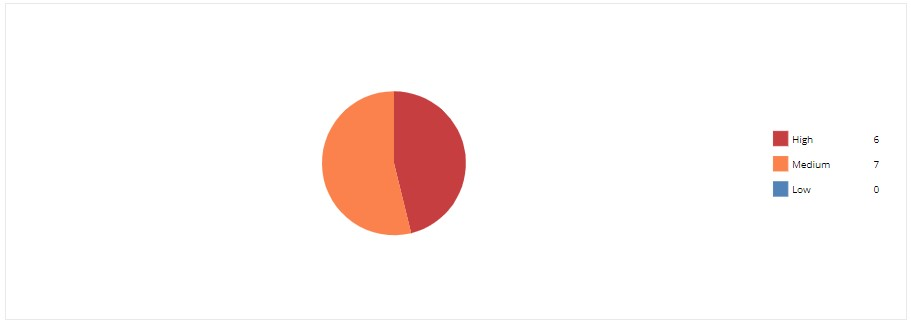
Alert Summary (Customer Level Only)
This reports displays a pie chart showing the volume of high-, medium-, and low-severity alerts for selected devices.
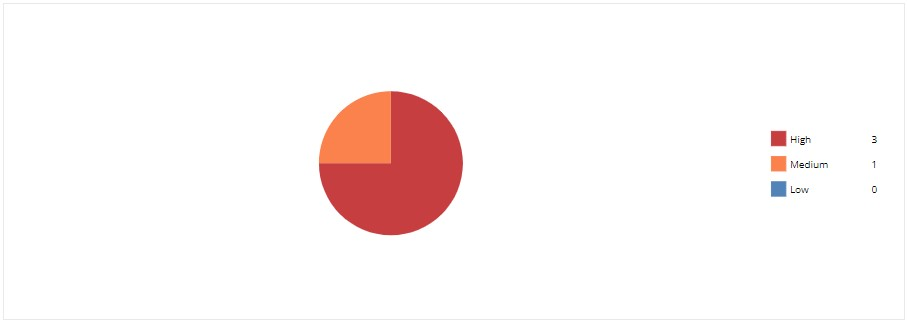
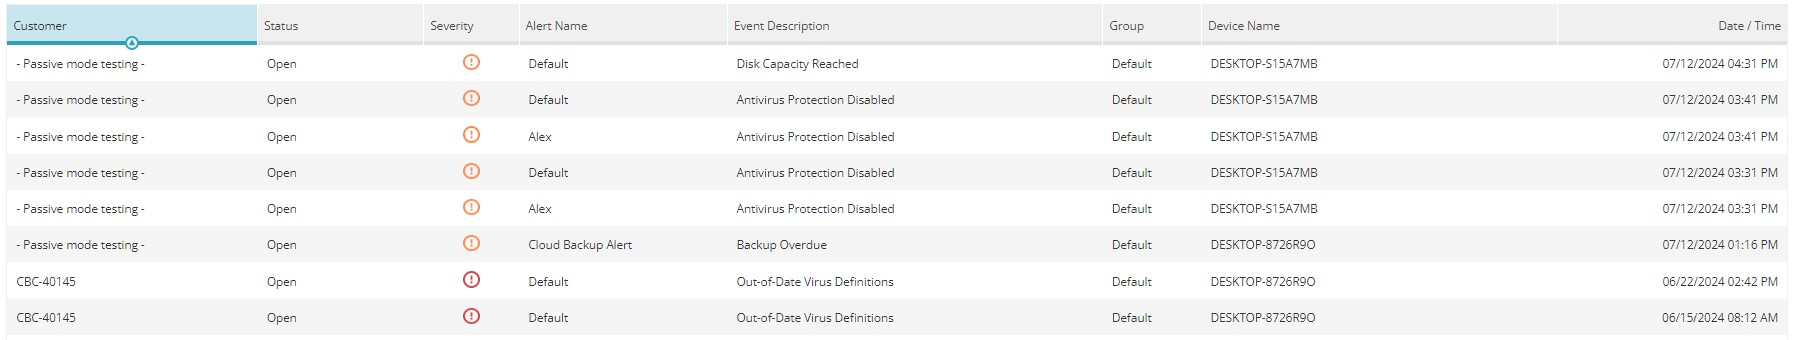
It also provides a table containing the following information about each alert:
- Alert's status, severity, and name
- Event description
- Group and name of the device for which the alert was triggered
- Date and time when the alert was triggered
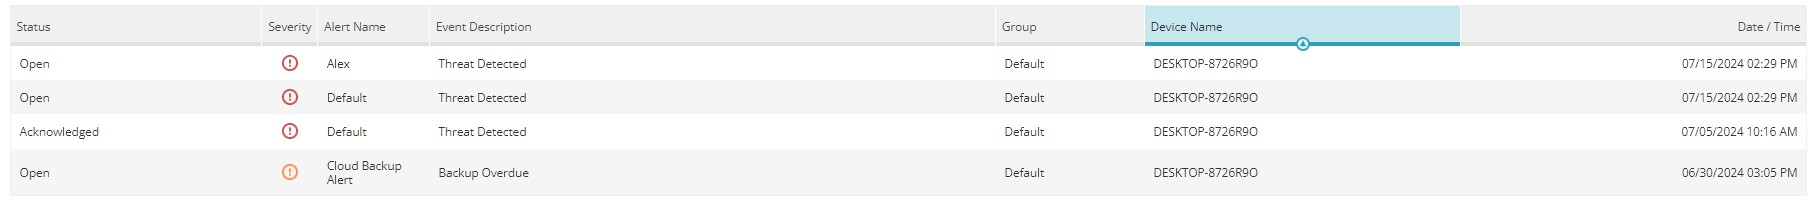
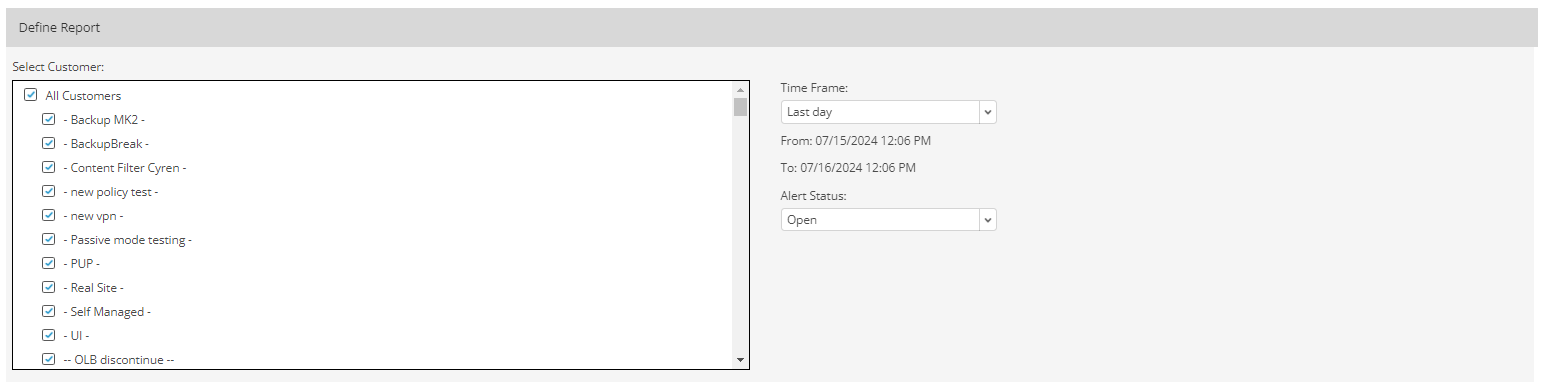
The report can be configured to show information for the last/previous day, week, month, or 3 months for all or only selected devices/device groups. Also, the report can include alerts with any status or only those that are open, acknowledged, or auto-akcnowledged.
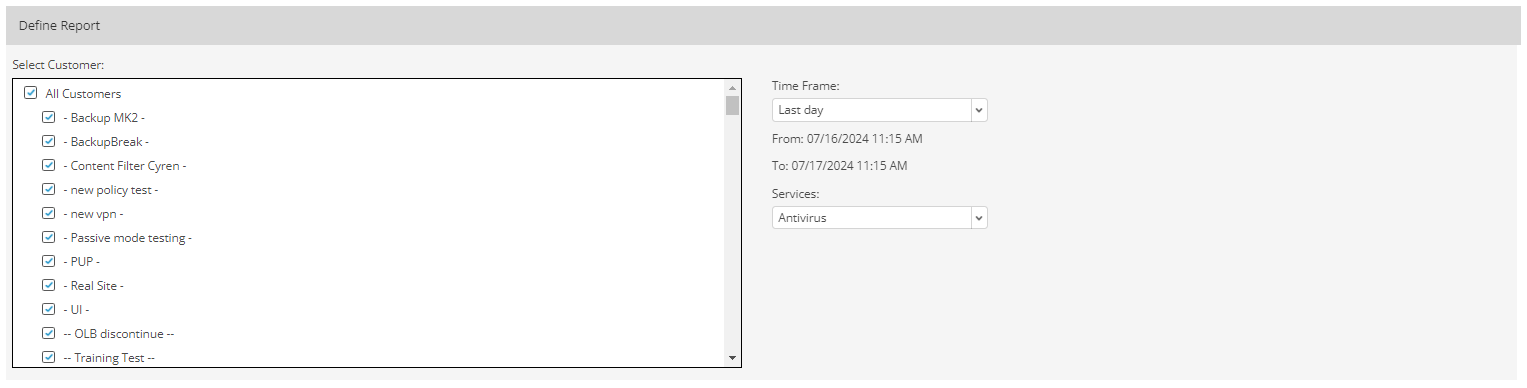
Client-Side Log Summary
This report lists logs generated by the Antivirus and Content Filtering services and includes the following information for each log:
- Customer (at partner level)
- Device's name, group, and IP address
- Component that generated the log entry
- Log entry
- Date and time the log was generated

The report can be configured to show information for the last/previous day, week, month, or 3 months for all or only specific services. At partner level, the option to include all or only specific customers in the report will also be available.
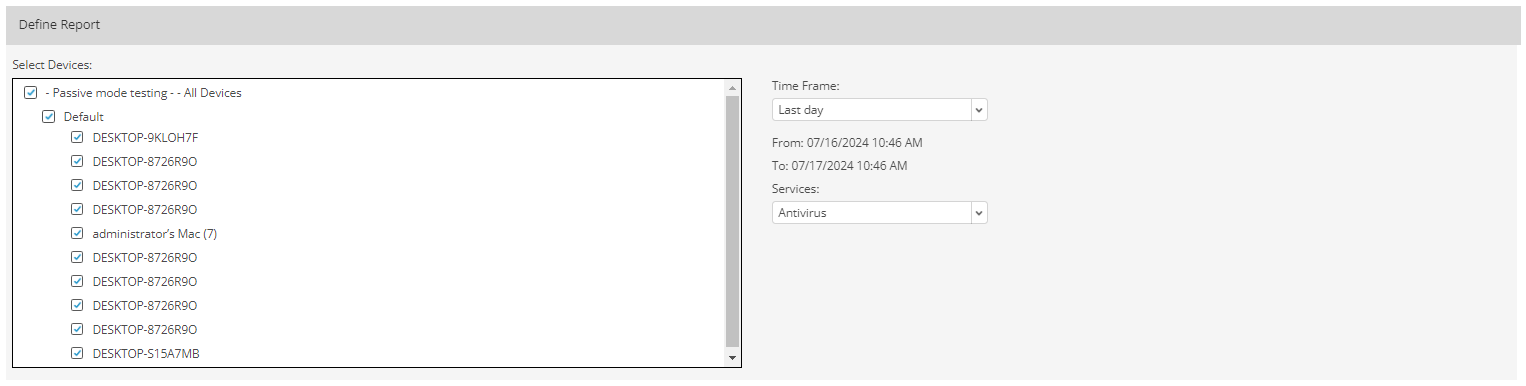
At customer level, it is possible to generate the report for all or only specific devices/device groups.
Customer Alerts (Partner Level Only)
This reports displays a pie chart showing the volume of high-, medium-, and low-severity alerts for selected customers.
It also provides a table containing the following information about each alert:
- Customer
- Alert's status, severity, and name
- Event description
- Group and name of the device for which the alert was triggered
- Date and time when the alert was triggered
The report can be configured to show information for the last/previous day, week, month, or 3 months for all or only specific customers. Also, the report can include alerts with any status or only those that are open, acknowledged, or auto-akcnowledged.
Device Overview
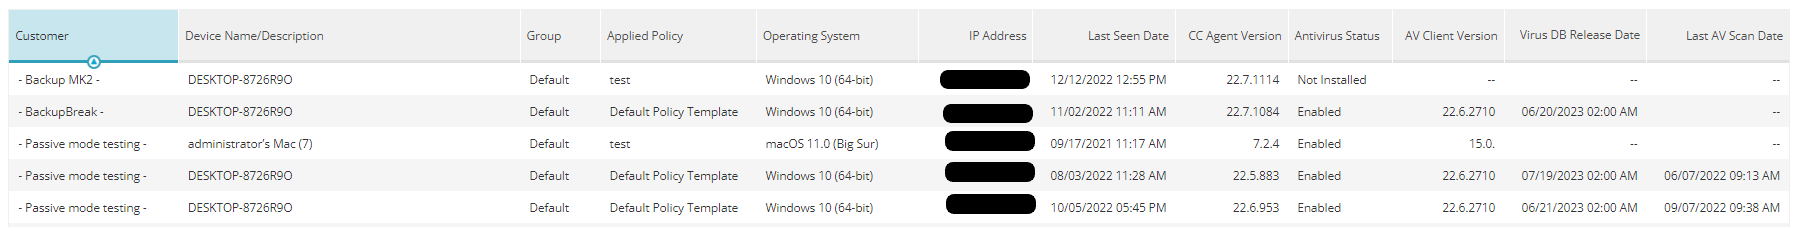
This report provides the following information for each listed device:
- Customer (at partner level)
- Device's name/description, group, OS, and IP address
- Applied policy
- Date and time when the device was last seen
- CloudCare Agent version
- Antivirus status
- Antivirus client version
- Virus database release date
- Date and time when the Antivirus scan was last run
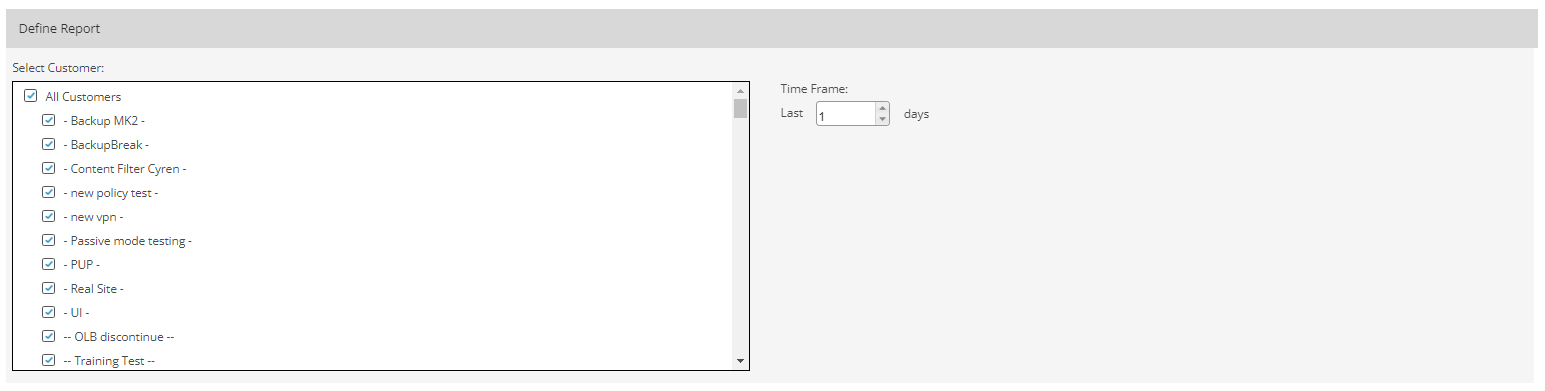
At partner level, the option to include all or only specific customers in the report will be available.
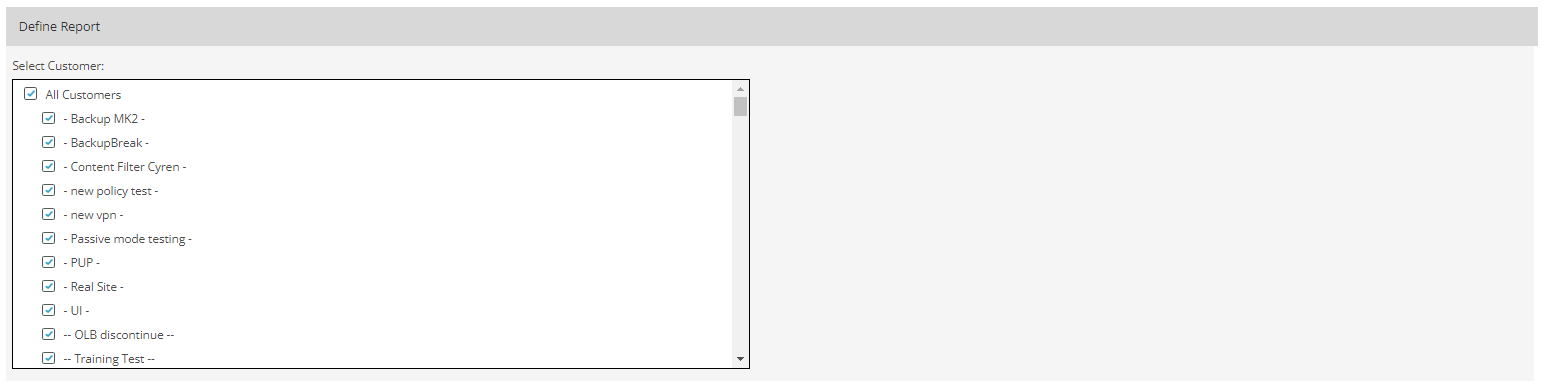
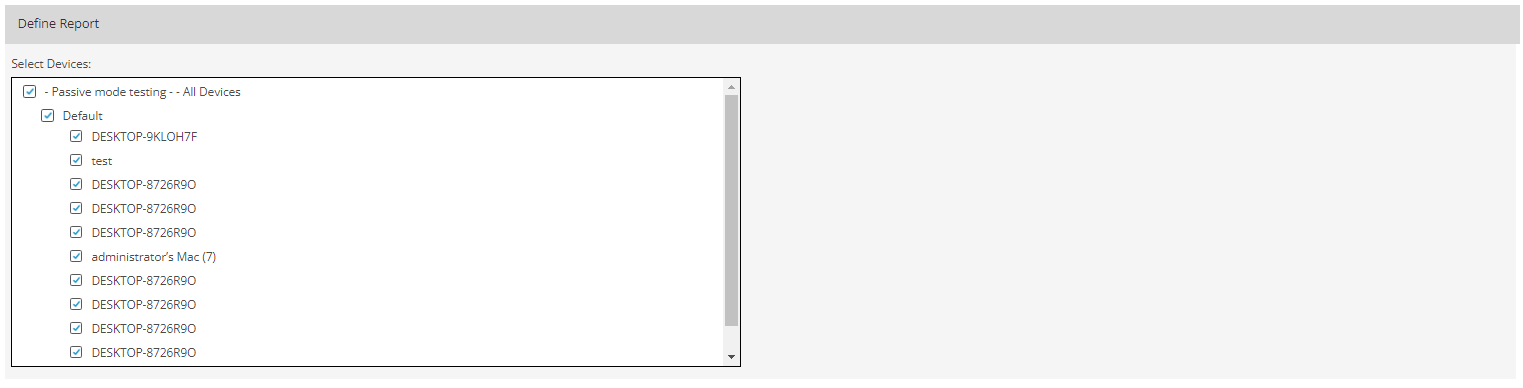
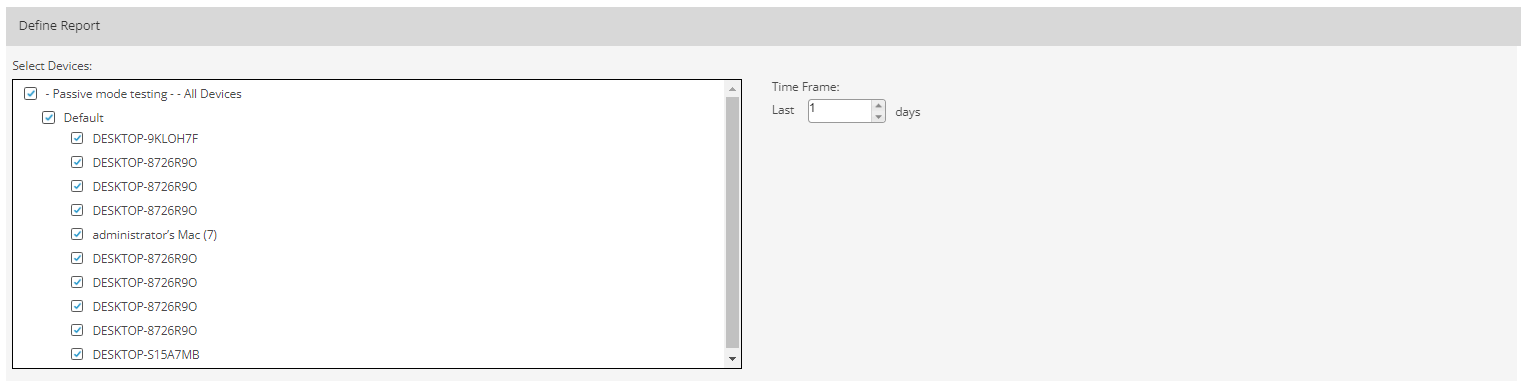
At customer level, it is possible to generate the report for all or only specific devices/device groups.
E-Mail Device Deployment
This report displays the following information about CloudCare deployments initiated via email:
- Customer (at partner level)
- Deployment request date
- Email address the request was sent to
- Device's hostname/description, IP address, and MAC address
- Install status (Success, Failed, Pending)

The report can be configured to show information for the last/previous day, week, month, or 3 months. At partner level, the option to include all or only specific customers in the report will also be available.

Non-Communicating Devices
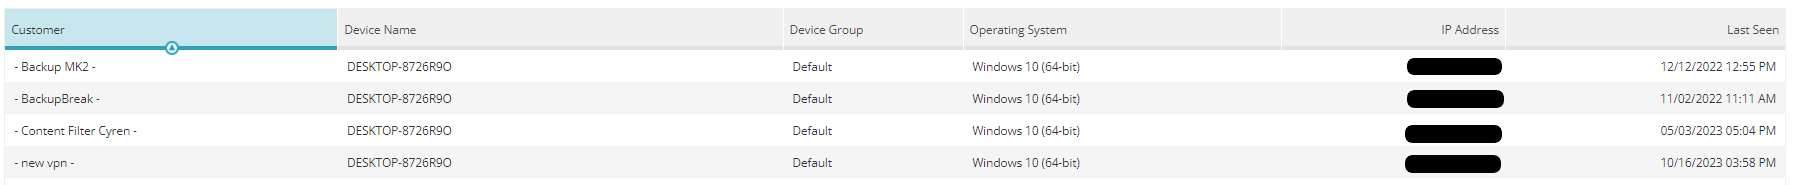
This report shows the following information about each listed device that has not communicated with the CloudCare portal for a certain period of time:
- Customer (at partner level)
- Device's name, group, OS, and IP address
- Date and time the device was last seen
The report can be configured to show information for up to a maximum of 90 days preceding the current date. At partner level, the option to include all or only specific customers in the report will also be available.
At customer level, it is possible to generate the report for all or only specific devices/device groups.
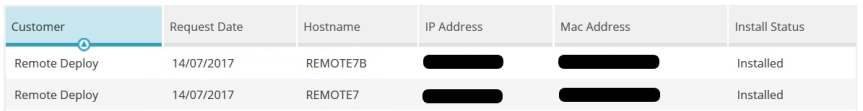
Remote Device Deployment
This report displays the following information regarding CloudCare deployments performed using the remote deployment option:
- Customer (at partner level)
- Deployment request date
- Device's hostname/description, IP address, and MAC address
- Install status
The report can be configured to show information for the last/previous day, week, month, or 3 months. At partner level, the option to include all or only specific customers in the report will also be available.

Server-Side Log Summary
This report lists server-side logs and includes the following information for each log:
- Customer (at partner level)
- Server–side event name (refer to the Event Table for a complete list of server–side events)
- Event details
- Date and time the event took place

The report can be configured to show information for the last/previous day, week, month, or 3 months. At partner level, the option to include all or only specific customers in the report will also be available.
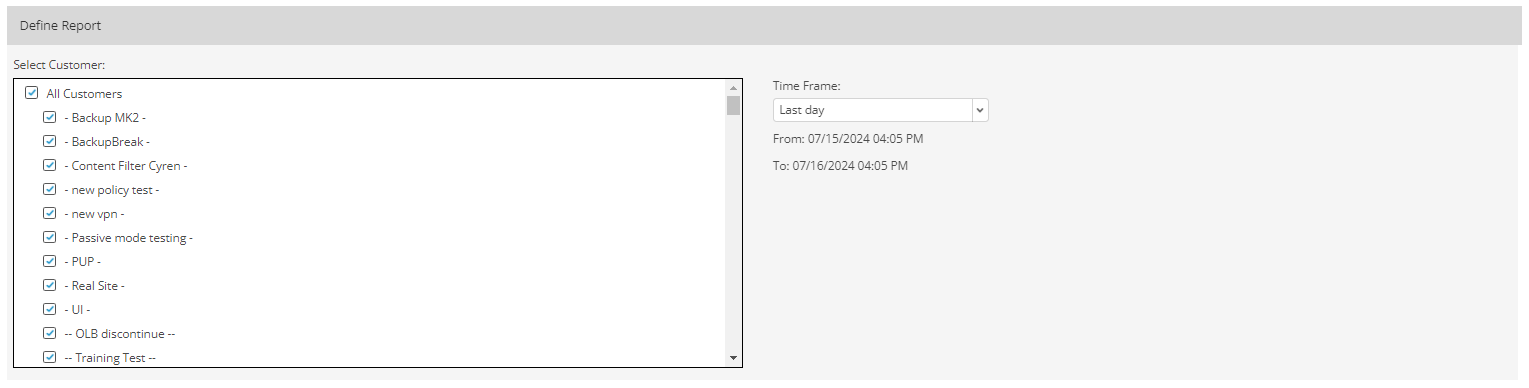
Service Overview
Displays the paid and trial subscription count for each service, and includes information on the service's status, version (when applicable), and next subscription (when applicable).
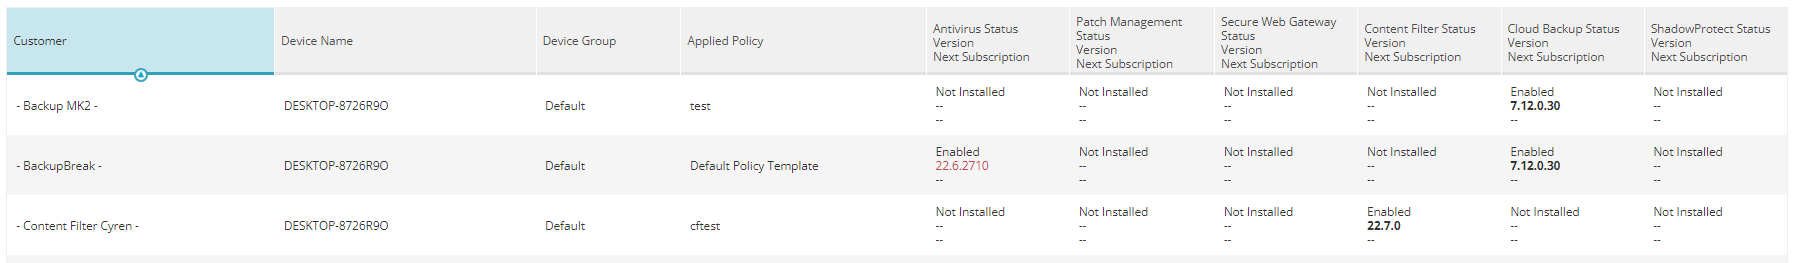
At partner level, the option to include all or only specific customers in the report will also be available.
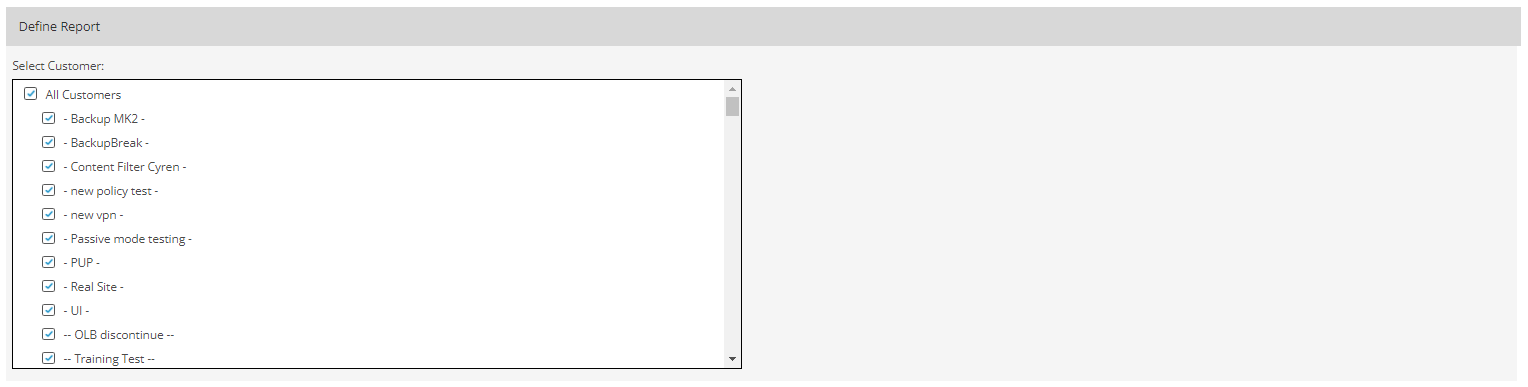
At customer level, it is possible to generate the report for all or only specific devices/device groups.
Service Summary (Customer Level Only)
This report provides information on the number of paid and trial licenses for each active service.

There are no configuration options available for this report type.
